Different Coloured Gold Alloys
From ancient times, gold has been used mostly in decorative items, and the colour of gold plays an important role in this application field. Different methods have been developed to objectively characterize the colour. This paper describes the CIELAB system, which has gained acceptance as an effective way to assess colour. The different coloured gold alloys known today are also described, with emphasis on the relationship between their metallurgy and their colour.
22 Minute Read
This article talks about the different kinds of coloured gold alloys, their make up and metallurgy and color measurements.
From ancient times, gold has been used mostly in decorative items, and the colour of gold plays an important role in this application field. Different methods have been developed to objectively characterize the colour. This paper describes the CIELAB system, which has gained acceptance as an effective way to assess colour. The different coloured gold alloys known today are also described, with emphasis on the relationship between their metallurgy and their colour.
The history of gold goes hand in hand with the evolution of human civilization, influencing its extension and development ever since the first gold item was created. The rich yellow colour of gold has always been attractive to mankind, and gold has been used in all parts of the world, since as far back as 3000 BC (1, 2)
Gold and copper are the only two metals that exhibit colour. Owing to this property, gold alloys can be made to assume a range of colours by varying the alloying additions. In 862 BC the Lydians were using coins made of a green gold-silver alloy known as 'electrum' and composed of 73wt%Au and 27wt%Ag. A red gold alloy, the combination of 70wt%Cu with 30wt%Au, was used during the time of the Chimu Empire (ca 1300 AD) by goldsmiths in what is today northern Peru (3). Today, various coloured gold alloys are available, giving the opportunity of creating unique jewellery and decorative items.
It is the intention of this paper to briefly review the formation of, and assessment of, colour in metals, as well as the different coloured gold alloys and their properties.
Formation of Colour in Metals
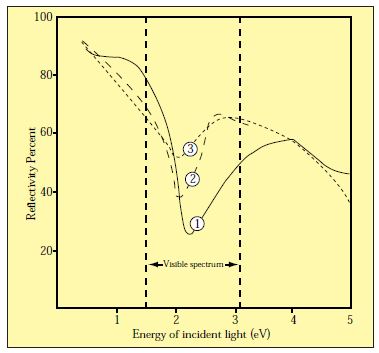
We perceive colour when the different wavelengths composing white light selectively interfere with matter by absorption, diffraction, reflection, refraction or scattering, or when a non-white distribution of light has been emitted by a system (4). The wavelength of visible light is of the order of 380-780 nm. Figure 2 shows the energy of the visible spectrum. The formation of colour in metallic elements and their alloys can be explained by means of the band theory. When metal and light interact, electrons from the metal surface situated either below or on the Fermi level absorb photons and enter an excited state on or above the Fermi surface respectively (5). The efficiency of the absorption and reemission of light depends on the atomic orbitals from which the energy band originated (4). A white reflected light will result if the different colours in white light are reflected equally well. In the case of gold and copper, the efficiency decreases with increasing energy, resulting in yellow and reddish colours due to the reduction in reflectivity at the blue end of the spectrum.
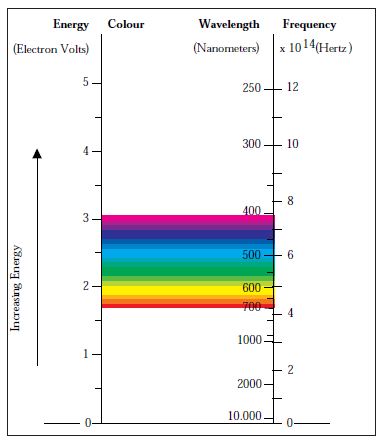 |
| Figure 2 - Wavelengths in the visible spectrum. |
Measurements performed on gold alloys with various amounts of silver (Figure 3) show a high reflectivity exhibited by fine gold for the low energy part (below 2.3 eV) of the visible spectrum (6) (Figure 2). This means that the yellow colour of gold is formed by a selective reflection of the red-yellow wavelengths. As the silver content increases, a higher reflectivity is displayed for the high energy part of the visible spectrum. Silver has a very similar electronic structure to that of gold, but the transition of electrons above the Fermi level requires energy in excess of that of the violet end of the visible spectrum, and thus all the visible spectrum is reflected, resulting in the characteristic white metallic colour (6).
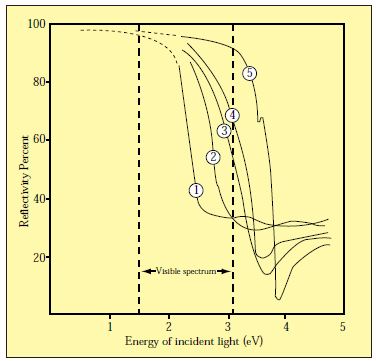 |
| Figure 3 - Reflectivity as a function of energy of the incident light. 1 - fine gold, 2 - Ag50at%Au, 3 - Ag10at%Au, 4 - Ag5at% Au, 5 - fine silver (6). |
Colour Measuring System
In some applications of gold, mostly in jewellery and dentistry, the colour plays an important role. For a very long time, the colour was estimated visually by the producer, but this is no longer appropriate, as the human eye is subjective. There are cases when the colour is the sine qua non condition, as when selecting a solder for repairing a jewellery item. Such repairs and today's mass produced jewellery both require an objective way of measuring colour. Even small variations in the colour of similar items are a sign of non-professionalism and poor quality, and can be very costly for jewellery manufacturers.
The need for accurate colour measurement led to the creation of different systems designed to assess the colour. The Munsell system describes the colour by using three co-ordinates: 'hue', 'chroma' and 'value' (7). The 'hue' is the colour name described in words (red, green, blue, etc.), 'chroma' denotes the intensity of the colour as the separation from a white-grey-black axis, and the 'value' describes the position on the white-grey-black scale. The Munsell system still relies on the human eye, and colours are described by visually comparing them with standard files and finding the closest match.
However, the jewellery industry requires a system whereby a reference point for colour can be established in order to have uniformity between the various manufacturers. The DIN system used as the European reference for gold colour is based on physical colour comparison with a standard gold panel. Drawbacks of this system are that colour identification still depends on the eye, and lower caratage gold panels are subject to discolouration due to tarnishing with time.
The Manufacturing Jewellers & Silversmiths of America's Committee for Color References has brought out a Gold Color Reference Kit that is based on the CIELAB system (8, 9). This system offers the advantage of describing colour mathematically without the intervention of the human eye, and forms part of the American Society for Testing and Materials standard on colour and appearance. CIELAB is an internationally recognized colour measurement system that was developed by CIE (the International Commission on Illumination) and adopted in 1976.
The CIELAB method expresses the colour as three-dimensional coordinates: L*, a*, and b*, where L* is the luminance (brightness) (10). An L* value of 0 means that no light is reflected by the sample, and an L* value of 100 means that all incident light is reflected. The a* co-ordinate measures the intensity of the green (negative) or red (positive) component of the spectrum, while the b* co-ordinate measures the intensity of the blue (negative) or yellow (positive) component. The colour of a sample can be defined by plotting these co-ordinates as a point in the three-dimensional space depicted in Figure 4.
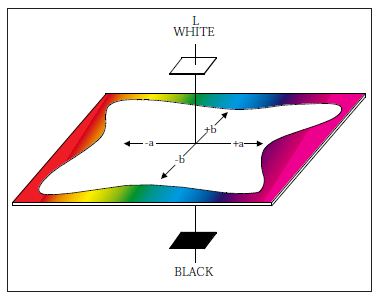 |
| Figure 4 - The L*, a*, b* threedimensional coordinate system. |
The values of L*, a* and b* of a sample are obtained as direct readings from a spectrophotometer which is connected to a computer. The spectrophotometer has a resolving power between five and ten times greater than the human eye (7, 10). As the colour of a sample depends on the illuminant, the sample itself and the observer, the spectrophotometer uses an artificial light source that simulates natural light, an array of photodiodes, and the computer as the observer. Different problems related to measuring colour such as objectivity, accuracy and reproducibility are resolved by this system.
Colour Measurements
Figure 5 shows the a* and b* colour co-ordinates of various coloured gold alloys. Their compositions are listed in Table 1.
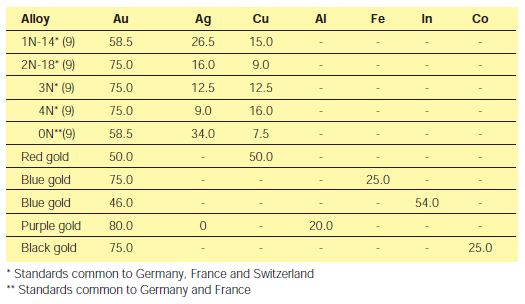 |
| Table 1. Compositions of Coloured Gold Alloys (wt%) |
The colour difference can also be a measure of the tarnishing of an alloy. By calculating the distance between two points in the CIELAB system, the difference in colour can be numerically described. The DE* value represents this distance and can be calculated (11) with the formula: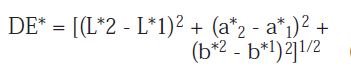
The subscripts 1 and 2 refer to the co-ordinates of the initial and the tarnished sample respectively; L*, a* and b* were defined above as being the CIELAB colour co-ordinates of the respective alloys/samples - see text near Figure 4. The DE* described the distance between two points representing the colour of the samples in the tridimensional CIELAB system. By plotting the DE value versus the heat treatment time, the colour change can be visualized in a graph such as the one in Figure 6. In this case, the tarnish behaviours of two gold alloys are compared with a standard one.
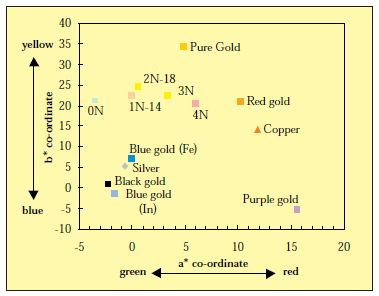 |
| Figure 5 - CIELAB co-ordinates of various coloured gold alloys. |
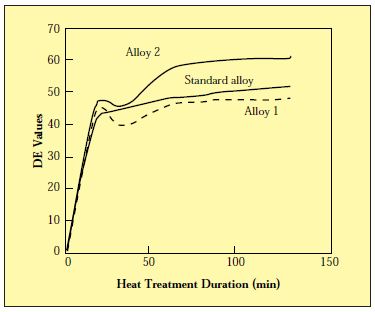 |
| Figure 6 - Colour differences of three alloys after the same heat treatment in air. The closer the curves are to the standard, the smaller the colour difference. |
Coloured Gold Alloys
Alloying additions to gold and copper can create various colours, resulting in diversity in jewellery applications. It is less well known, however, that gold alloys can have colours which are surprisingly different to the conventional alloys, as in the case of blue, black or purple gold alloys. In this paper coloured gold alloys are classified in the following three main metallurgical categories:
- Au-Ag-Cu System
- Intermetallic compounds
- Surface oxide layers.
Au-Ag-Cu System
The Au-Ag-Cu system is the basis of the most common gold jewellery and dental alloys used today, and dates back several millennia. Colour variations of yellow, red and green can be obtained by different ratios of Au:Ag:Cu. Figure 8 illustrates the rich, yellow colour of high carat gold. White gold is also based on the Au- Ag-Cu system, and the white colour results from alloying with elements known for their bleaching characteristics, such as nickel (Ni), palladium (Pd), and manganese (Mn). Alloying additions to the ternary system are also used to improve properties like castibility and hardness.
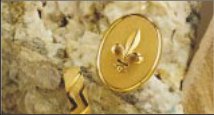 |
| Figure 8 - Items produced with hard 24 carat gold revealing the rich, yellow colour of the metal. |
Yellow, Green and Red Gold Alloys
A multitude of hues and colours can be obtained in the Au-Ag-Cu system alone by variation of composition as shown in the ternary phase diagram in Figure 9. Additions of copper give a reddish tint to the alloy, and additions of silver make the alloy greenish. In accordance with band theory, the addition of silver to the Au-Cu alloy causes a widening of the energy gap that the electrons have to overcome to reach an energy state above the Fermi level. The wider the gap, the higher the energy absorbed from the incident light, and therefore the reflectivity increases not only for the red and yellow regions of the spectrum, but also for the green (6).
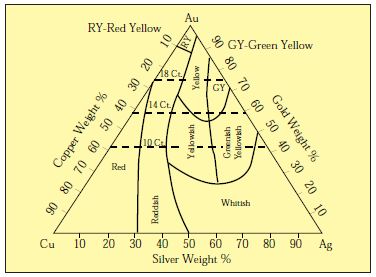 |
| Figure 9 - Relationship between colour and composition in the ternary Au-Ag-Cu system (12). |
The metallurgy of the ternary Au- Ag-Cu system, including the orderdisorder phenomena, has been extensively studied, and reviewed indepth by Prince et al (13), Rapson (14, 15), and Yasuda (16).
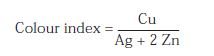
Zinc (Zn) additions of up to 15wt% can be added to alloys of the Au-Ag- Cu system to change the red colour of copper-rich alloys to reddish yellow or dark yellow (17). These alloys are characterized by good workability. Zinc additions affect both AuCu ordering and the extent of the two phase a1 + a2 region and, therefore, affect the age-hardening characteristics of the alloys (17, 18). A relationship between the composition and colour was developed for 14 carat alloys containing zinc (19). After many colour measurements, a colour index was designed, which can be calculated from the weight percentages of silver, copper and zinc using the following formula:
Cadmium (Cd) additions of up to 4wt% have also been used for the production of 18 carat green alloys. 75Au-23Cu-2Cd results in a light green alloy, and 75Au-15Ag-6Cu-4Cd is the composition of a dark green alloy (20). Cadmium is mostly known as an alloying element used for production of solders. However, CdO is considered very toxic, being an irritant to the respiratory system, causing irreversible damage to the kidney, and is classified by the International Agency for Research in Cancer as a carcinogen (21, 23).
White Gold
White gold alloys were originally developed as substitutes for platinum, and are commonly used in the jewellery industry for diamond
setting, combination white/yellow jewellery items, and clasps (electroplated with yellow gold) for high-quality collars due to their high strength. These alloys have been used less than the coloured gold alloys in the past, but fashion trends and the increase in the gold price in 1972-1973, brought silver jewellery and white gold into prominence (24). In Europe, a new trend towards more white gold jewellery has recently become apparent.
The white gold alloys used in the jewellery industry are based primarily on Au-Cu-Ni-Zn, and Au-Pd-Ag combinations. The bleaching effect of nickel or palladium is a result of lowering the reflectivity of the alloy for the low energy part of the visible spectrum. Absorption processes become possible at energies considerably lower than for pure gold, and the reflectivity is reduced in the red and infrared regions of the spectrum (6). Figure 12 shows the reflectivity curves for different nickel and palladium-containing alloys.
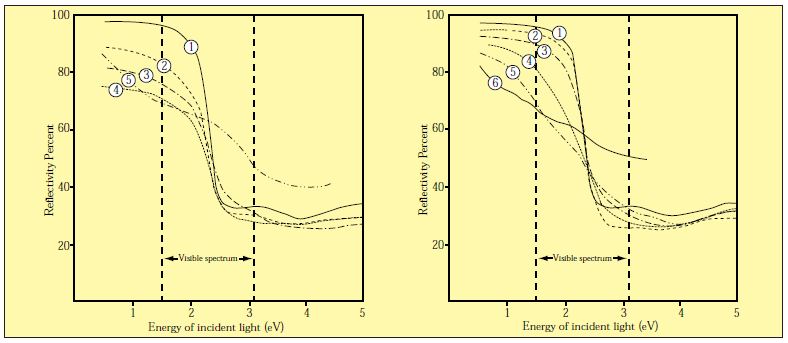 | |
| click to enlarge Figure 12 - Reflectivity curves for Ni-(left) and Pd-(right) containing gold alloys (6). | |
Left:
| Right:
|
Nickel has traditionally been used for white gold alloys because of its low cost and strong bleaching effect. In the gold-copper-nickel-zinc alloys, nickel is the primary bleaching agent, and zinc is used as secondary bleacher to compensate for the colouring effect of copper. Nickelcontaining white gold alloys are characterized by their high as-cast hardness, rapid work hardening and tendency to fire-cracking. The commercial alloys undergo separation into gold-rich (Au-Cu) and nickel-rich (Ni-Cu) phases, which produces considerable hardness (25). As these alloys have poor formability, frequent intermediate annealing treatments are required (26). Copper is added to improve plasticity and workability. The use of nickelcontaining gold alloys in the jewellery industry has become less popular, due to the allergic reaction caused by nickel when in contact with the skin (27).
Comparison between the properties, advantages and disadvantages of nickel- and palladium-containing white gold alloys has received considerable attention in the literature (28, 31). The palladium-containing white gold alloys are characterized by low ascast hardness, excellent ductility and cold working properties, good colour match with sufficient palladium additions, and no tendency to firecracking. The colour of the Au-Pd alloys ranges from yellow gold to white after the palladium content reaches 15wt%. However, palladiumcontaining gold alloys are unattractive due to their high liquidus temperature and high density, and in particular because of the increasing cost of palladium.
Primary requirements desirable in white gold alloys include (32):
- Suitable white colour and high reflectivity
- A reasonable hardness in the as-cast and annealed states (arbitrarily <200 VH)
- Adequate cold workability formability (arbitrarily >25% elongation)
- A relatively low liquidus temperature (arbitrarily <1100°C)
- Cost-effective alloying elements
A considerable amount of work has been done to identify alloying elements that would yield the desired combination of properties required for an ideal white gold alloy. Table 2 summarizes the bleaching effects that different alloying elements have on gold.
 |
| Table 2. Potential Alloying Elements for White Gold Alloys and Indications of their Bleaching Effects (27-29, 32, 33). |
Intermetallic Compounds Purple Gold
The intermetallic compounds are a special group of materials with properties very different from the individual metals that constitute them. An intermetallic compound is defined by an intermediate phase in an alloy system, having a narrow range of homogeneity and relatively simple stoichiometric proportions. They are usually brittle, which makes their use in traditional jewellery virtually impossible, but can, however, be faceted and used as gemstones or inlays.
The best known among these compounds is AuAl2, which is formed at 79wt%Au and 21wt%Al (34). AuAl2 has a higher melting point than its constituents, indicating the compound's thermodynamic stability. The compound is characterized by its beautiful purple colour.
The purple gold compound has received considerable attention from the microelectronic industry. If bonds between gold and aluminium in electronic devices are heat treated above 250°C, all five gold-aluminium intermetallic compounds (Au4Al, Au5Al2, Au2Al, AuAl and AuAl2) develop (15). Studies conducted on bimetallic metal systems revealed that Au2Al and Au5Al2 form first, and that AuAl2 is the final equilibrium phase (35, 36). Differential diffusion rates of aluminium and gold lead to formation of Kirkendall voids causing porosity and, eventually, breakage of the aluminium-gold joint (37). This mechanical failure was nicknamed 'purple plague'. However, although the purple gold compound is brittle, it is stable and does not disintegrate with heat treatment (38).
The Au-Al phase diagram (Figure 14) contains a number of intermetallic compounds formed at compositions situated close to the gold-rich end of the diagram. AuAl2 has a gold content close to that of an 18 carat alloy (75 per cent gold), which makes it possible to produce a hallmarkable 18 carat purple alloy.
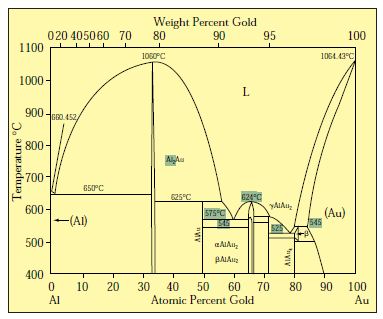 |
| Figure 14 - Au-Al phase diagram (39). |
The microstructure of an 18 carat purple gold alloy (Au / 25wt%Al) is shown in Figure 15, where the light grey phase represents the purple colour (38). As the composition deviates from AuAl2 towards the aluminium-rich side of the phase diagram, the colour approaches that of aluminium. The volume percentage of the purple intermetallic phase decreases, with an increase in the second-phase consisting of an aluminium-rich solid solution. When the composition deviates from the AuAl2 to the gold-rich side of the phase diagram a new intermetallic compound, AuAl, forms at 88wt%Au content and replaces the AuAl2, altering the alloy's colour. The purple colour is preserved until the aluminium content decreases to 15wt% (40).
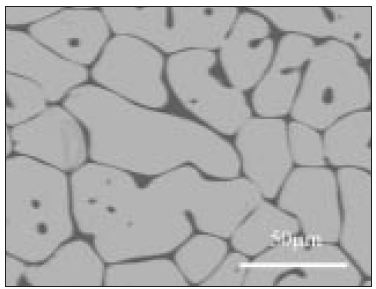 |
| Figure 15 - Secondary electron image of as-cast Au-25 per cent Al purple gold (38). |
The crystal structure of AuAl2 was determined in 1934 to be the simple cubic CaF2 structure (Figure 16). More recent research (41) revealed that the aluminium sublattice is incompletely occupied and that the actual composition of AuAl2 is closer to Al11Au6.
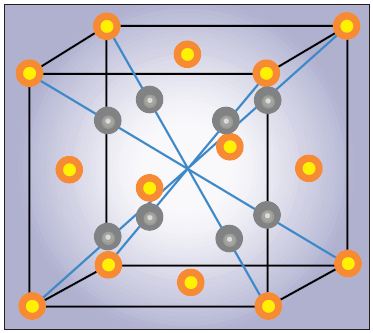 |
| Figure 16 - Crystal structure of CaF2 - prototype for AuAl2, AuIn2 and AuGa2 (42). |
Blue Gold
Two other intermetallic compounds that are known to produce colours in gold alloys are AuIn2, which has a clear blue colour, and AuGa2 (6), which displays a slight bluish hue. Figures 17 and 18 show the Au-In and Au-Ga phase diagrams. The goldindium intermetallic compound AuIn2 forms at 46wt%Au, and AuGa2 at 58.5wt%Au. Both have a similar crystal structure to the purple gold compound which is based on the CaF2 prototype. The blue colour is 'diluted' in a similar manner to that of purple gold.
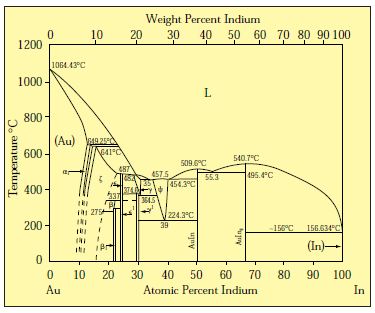 |
| Figure 17 - Au-In phase diagram (39). |
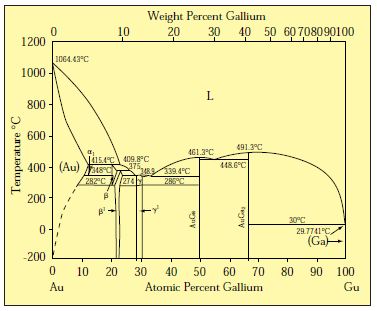 |
| Figure 18 - Au-Ga phase diagram (39). |
The intermetallic compounds behave in some ways like pure metals, which makes it possible to calculate their band structures. The reflectivity falls in the middle of the visible spectrum and rises again towards the violet end, giving distinctive colours in each case (43). Figure 19 shows the reflectivity as a function of the energy of the incident light for AuAl2, AuIn2, and AuGa2.
 |
| Figure 19 - The reflectivity as a function of the energy of the incident light for the intermetallic compounds: 1 - AuAl2, 2 - AuIn2, 3 - AuGa2. (6). |
Spangold
Certain Au-Cu-Al alloys form an interesting surface texture resulting in a new family of gold alloys known as 'Spangold' (44, 45). Two different colours are produced by these intermetallic compounds: a yellow 76Au-19Cu-5Al alloy, and a pink 76Au-18Cu-6Al alloy. The decorative spangling effect is the result of a change in the crystal structure which creates many small facets on the previously polished surface. During cooling from the high temperature phase, the alloys undergo a quasi-martensitic transformation, which involves ordering of the atoms and shear. The observed behaviour can be explained by assuming that the alloys exist in two structures: a high-temperature ordered B2-type phase, which is body-centred cubic, and an ordered phase stable at lower temperatures, which has a body-centred tetragonal structure (46).
By cooling the material below 20°C, the high-temperature phase is converted to the structure of the ordered phase irrespective of the cooling rate. The spangling heat treatment is normally conducted by heating the item in a bath of hot oil at between 150 and 200°C for 10 minutes and then cooling it to below room temperature.
Surface Oxide Layers
The coloured gold materials described above have the common feature of preserving the same colour in cross section. In the quest for different colours, another technique is used, which involves the formation of a coloured oxide layer on the alloy during heat treatment in air. As gold does not discolour in air, the metal is alloyed with a base metal characterized by a low oxidation resistance. The oxide layer is only a surface film, and has limited thickness, which could result in the coloured layer being damaged when used in high wear applications. Surface oxidation is performed as the final treatment after the article has been buffed and polished.
Liver of sulfur (potassium sulfide) can be used to colour gold alloys containing a significant quantity of copper (18ct and lower), and a range of colours varying from brown to black can be obtained (20).
VA Blue Gold SA of Geneva launched, in 1988, an alloy that turns to a rich sapphire blue with heat treatment at 1800°C (47, 48). The gold, with content between 20 and 23 carat, is alloyed with ruthenium, rhodium and three other alloying elements. The blue surface layer is between 3 and 6 m in thickness. An 18 carat gold alloy, which consists of 24.4wt%Fe and a maximum of 0.6wt%Ni (49), forms a blue oxide layer on heat treatment in the atmosphere between 450 and 600C°. The oxide layer turns to a blue-green colour with an increase in gold content to 85wt%.
Black gold generally contains cobalt, which forms a black cobalt oxide layer on the surface with heat treatment between 700 and 950C (50, 51) . Other alloying elements also known to give a blackish layer on oxidation are copper, iron and titanium. Black gold alloys also contain at least one of the platinum-group metals, silver, or nickel.
Van Graan and Van der Lingen (52) improved the wear resistance of 18 carat cobalt-containing gold through chromium additions. An electrolytic hardening cycle such as that used after the colouring of stainless steel was incorporated (53). The addition of chromium results in a thinner oxide layer which consists mainly of Cr2O3 and has an olive-green hue. The wear resistance of an Au15wt%Co10wt%Cr was significantly better than that of a binary Au25wt%Co alloy, although the oxide layer was approximately
five times thinner (Figure 23). The microstructure of the alloy in Figure 23 is composed of a gold-rich phase containing ca 94wt%Au and a cobaltrich phase containing ca 90wt%Co. Between the CoO layer and the matrix, is a cobalt-depleted zone containing only ca 2.4wt%Co, resulting from cobalt segregation to the surface during oxidation.
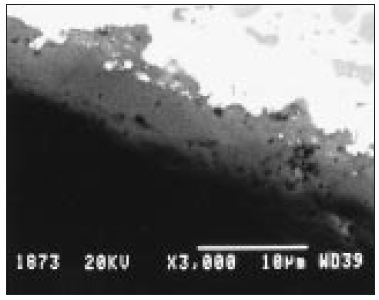 |
| Figure 23 - Secondary electron image of the oxide layer on the surface of the Au25wt%Co alloy. |
The Future of Coloured Gold Alloys
Gold jewellery has enchanted people for thousands of years. Hues and colours are only variations on the same artistic theme of beauty and brilliance. Gold will always be distinctive due to its unique yellow colour, but the need for diversity and originality will cause some of the coloured gold alloys to remain in fashion. New designs and ideas will certainly arise, and with today's knowledge and technologies, new solutions will most likely be found for the challenges posed by some of the coloured gold alloys.
Acknowledgements: This paper is published by permission of Mintek.
References
- S. Watanabe, in 'Precious Metals Science and Technology', eds. L.S. Benner, T. Suzuki, K. Meguro and S. Tanaka, International Precious Metals Institute, Allentown, 1991, 1
- World Gold Council, Gold Jewellery in the 1990s, Internet, http://www.gold.org/ Ginfos/Gi5jew.htm, 1999
- World Gold Council, The New World - Pizzaro and Atahualpa, Internet, http://www. gold.org/Ginfos/Gi1anc.htm
- K. Nassau, Colour Res. and Appl., 1987, 12, 4
- K. Yonemitsu, in 'Precious Metals Science and Technology', eds. L.S. Benner, T. Suzuki, K. Meguro and S. Tanaka, International Precious Metals Institute, Allentown, 1991, p.13
- K.E. Saeger and J. Rodies, Gold Bull., 1977, 10, 10
- D.P. Agarwal and G. Raykhtsaum, in 'The Santa Fe Symposium on Jewelry Manufacturing Technology 1988', ed. D. Schneller, Santa Fe, 1988, p. 229
- M. Plotnick, American Jewelry Manufacturer., Jan. 1991, 20
- G. Raykhtsaum and D.P. Agarwal, Gold Technol., 1997, No. 22, p. 26
- R.D. Overheim and D.L. Wagner, in 'Light and Color', John Wiley & Sons Inc., New York, 1982, 63, 253
- G. Raykhtsaum and D.P. Agarwal, American Jewelry Manufacturer, February 1990, 116
- J. Leuser, Metall., 1949, 3, 105
- A. Prince, G.V. Raynor and D.S. Evans, in 'Phase Diagrams of Ternary Gold Alloys', The Institute of Metals, London, 1990, p. 7
- W.S. Rapson, Gold Bull., 1990, 23, 125
- W.S. Rapson, in 'Intermetallic Compounds. Principles and Practice', eds. J.H. Westbrook and R.L. Fleischer, John Wiley & Sons, Chichester, 1994, 2, 559
- K. Yasuda, Gold Bull., 1987, 20, 90
- A.S. McDonald, and G.H. Sistare, Gold Bull., 1978, 11, 66
- D. Ott, Gold Technol., 1997, No. 22, p. 31
- D.P. Agarval and G. Raykhtsaum, in 'Precious Metals 1993, Proceedings of the 17th International Precious Metals Conference, Newport, Rhode Island', ed. R.K. Mishra, International Precious Metals Institute, Newport, Rhode Island, 1993, p. 153
- O. Untracht, in 'Jewelry Concepts and Technology', ed. R. Hale, Doubleday & Company, London, 1982, pp. 391, 718
- M. Dabalà, M. Magrini and M. Poliero, Gold Technol., 1998, No. 24, p. 6
- C.S. Freeman and C.J. Jones, in 'The Santa Fe Symposium on Jewelry Manufacturing Technology 1988', ed. D. Schneller, Santa Fe, 1989, p. 131
- G. Normandeau, in 'The Santa Fe Symposium on Jewelry Manufacturing Technology 1988', ed. D. Schneller, Santa Fe, 1989, p. 179
- W.S. Rapson and T. Groenewald, in 'Gold Usage', Academic Press Inc. Ltd., London, 1978, p. 9
- A.S. McDonald and G.H. Sistare, Gold Bull., 1978, 11, 128
- M.R. Pinasco and E. Stagno, Gold Bull., 1979, 12, 53
- P. Bagnoud, S. Nicoud, P. Ramoni, Gold Technol., 1996, No. 18, p. 11
- G. Normandeau, Gold Bull., 1992, 25, 94
- G. Normandeau and R. Roeterink, Gold Bull., 1994, 27, 70
- C.P. Susz and M.H. Linker, Gold Bull., 1980, 13, 15
- I.B. MacCormack and J.E. Bowers, Gold Bull., 1981, 14, 19
- G.P. O'Connor, Gold Bull., 1981, 11, 35
- M. Dabala, M. Magrini, M. Poliero and R. Galvani, Gold Technol., 1999, no. 25, p. 29
- W.S. Rapson, Gold Bull., 1996, 29, 141
- T. Inagaki, E.T. Arakawa and T.A. Callcott, J. Appl. Phys., 1981, 52, 5597
- R. Pretorius, T.K. Marais and C.C. Theron, Materials Science and Engineering, 1993, 10, 1
- T. Raymond, Semicond. Int., 1989, 12, 152
- R. Süss and C. Cretu, in 'MSSA Proceedings', eds. M. McLean, J.A.A. Engelbrecht, J.H. Neethling, C. Dennison, D. Mycock and R.H.M. Cross, Microscopy Society of Southern Africa, Johannesburg, 1998, 28, 20
- T. Massalski, J. Murray, B. Lawrence, B. Hugh, (eds.), 'Binary Alloy Phase Diagram', American Society for Metals, Metals Park, Ohio, 1986, 1, 90, 260, 270
- S. Hori, K. Kurokawa, T. Shimizo, M. Steel, M. Tsuboi and K. Yanagase, in 'Precious Metals Science And Technology', eds. L.S. Benner, T. Suzuki, K. Meguro and S. Tanaka, International Precious Metals Institute, Allentown, 1991, p. 430
- H. Büchler and K.-J. Range, J. Less-Common Met., 1990, 160, 143
- R. Cahn, Nature, 1998, 396, 52
- S.S. Vishnubhatla and J.P. Jan, Philos. Mag., 1967, 16, 45
- I.M. Wolff and M.B. Cortie, Gold Bull., 1994, 27, 45
- M. Cortie, I. Wolff, F. Levey, S. Taylor, R. Watt, R. Pretorius, T. Biggs and J. Hurly, Gold Technol., 1994, No. 4, p. 30
- F.C. Levey and M.B. Cortie, in 'Solid-State Phase Transformations '99', 1999, in press.
- C. Kremkov, Jewellery News Asia, June 1988, p. 48
- D.M. Lakin, Aurum, 1988, 34, 34
- L. Muller, United States Patent 5,059,255, 1991
- K. Nakama, European Patent 438980, 1991
- T. Takayanagi, N. Marita and C. Seki, United States Patent 5,139,793, 1992
- L. Van Graan and E. Van der Lingen, in 'MSSA Proceedings', eds. M. McLean, J.A.A. Engelbrecht, J.H. Neethling, C. Dennison, D. Mycock and R.H.M. Cross, Microscopy Society of Southern Africa, Johannesburg, 1998, 28, 19
- T.E. Evans, A.C. Hart and W.H. Sutton, British Patent 47048/72, 1972
Related Articles

Optimising Gold Alloys for Manufacturing

Alternative Metalsmith Pat Flynn
Gold Jewellery Tarnishing

Metal Conversion Chart


The All-In-One Jewelry Making Solution At Your Fingertips
When you join the Ganoksin community, you get the tools you need to take your work to the next level.