Colored Karat Golds for Investment Casting
In modern melting and casting technology, the need for products able to front competition in the field of quality and price encourages the development of new alloys that can guarantee better performance. Most significant innovations have taken place in alloys for investment casting, to improve the quality of castings. Additions of many elements to gold alloys have been experimented, but only a few of them appear to be sufficiently effective and easy to use. In this paper, we describe work carried out to examine technical and practical performances of some yellow 18 carat gold with additions aiming chiefly at improving alloy castability. Alloys of different composition have been tested and the effects of the different alloying additions have been compared, in order to find the addition elements that show better performance and able to give a true improvement of the quality level of the castings.
15 Minute Read
In modern melting and casting technology, the need for products able to front competition in the field of quality and price encourages the development of new alloys that can guarantee better performance. Most significant innovations have taken place in alloys for investment casting, to improve the quality of castings. Additions of many elements to gold alloys have been experimented, but only a few of them appear to be sufficiently effective and easy to use.
In this paper, we describe work carried out to examine technical and practical performances of some yellow 18 carat gold alloys (750‰ fineness) with additions aiming chiefly at improving alloy castability. Alloys of different composition have been tested and the effects of the different alloying additions have been compared, in order to find the addition elements that show better performance and able to give a true improvement of the quality level of the castings.
Experimental Conditions
Composition of the alloys Five different yellow gold alloys have been prepared. Their colour was 2 N, a very popular yellow colour that corresponds to 750 gold-150 silver -100 copper (as specified in the standard EN 28654).
The compositions of the alloys are shown in Table 1. It can be seen that the five alloys have a similar composition; the only difference is the addition of minor amounts of different alloying elements whose effect we wanted to test: zinc (Zn), silicon (Si), cobalt (Co) and iridium (Ir).
Alloy A is the reference alloy and does not contain zinc (Zn). This alloy corresponds to the standard 2N alloy and is a basic and traditional alloy that the goldsmith can produce by himself in his shop. The remaining alloys contain Zn (alloy B) and different combinations of some more alloying additions (alloys C, D, E). The different additions aim at:
- improving form filling capability,
- deoxidizing the alloy,
- refining grain size.
The concentration of the different additions has been decided on the basis of our experience and of information presented in Symposia or in technical journals.
 |
| Table 1. Nominal Composition of the alloys |
Shape of the Castings
As shown in Figure 1, specimen No 1 has been used for hardness measurement, specimen No 2, a 16 mm x 8 mm x 0.5 mm plate, for colour evaluation and specimen No 3 has been used for the tensile tests. The grid pattern shown in Figure 2 has been used for testing form-filling capability. Specimen No 1 has been used also for grain size evaluation and specimen No 2 for the observation of defects. Different cross sections of these samples have been cut, polished and etched for examination.
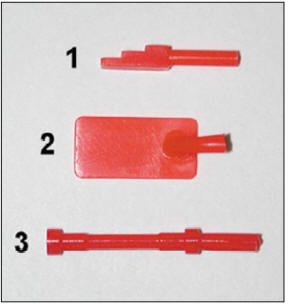 |
| Figure 1 - Test specimens for alloy characterization |
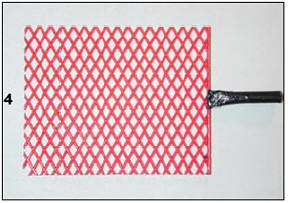 |
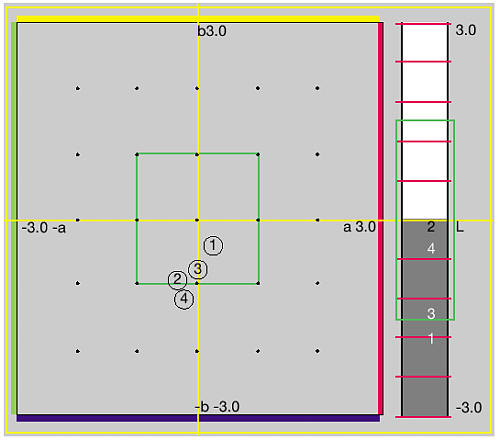
| Figure 2 - Test specimen for form filling capability |
Testing Methods
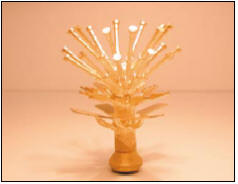
Wherever possible, equipment calibration and tests have been carried out in accordance with ASTM standards. The results given in the tables and the figures are averages of the data obtained from all the cast test specimens: five flasks have been cast for each alloy. Each tree in the flasks contained 20 tensile test specimens, 10 step wedge specimens and 5 plate specimens, Figure 3. The equipment used for the tests is detailed in Table 2.
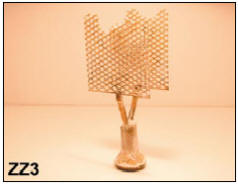 | Figure 3 - Cast tree for form filling capability evaluation |
 | Figure 4 - Cast tree with test specimens |
Standards to assess form-filling capability were not available and the tests have been carried out as follows: Two grid patterns have been mounted on one tree, Figure 4. The grid size was: L = 40 mm, H = 50 mm, D = about 0,9 mm. Flask preparation and alloy casting have been carried out in the same way for all alloys. To evaluate form-filling capability (expressed as % of filling), the grid patterns have been weighed. So the percent of filling is:
![]()
Where:
M.R. = weight of the cast grid pattern
M.I. = calculated weight of the completely filled grid pattern
In this case too, the figures given in the table are the average of the results from five different cast flasks.
Alloy preparation, melting and casting Melting and casting have been carried out as follows:
- Preparation of the master alloys,
- Melting and casting,
- Testing the cast specimens.
Preparation of the master alloys The master alloys have been prepared to guarantee homogeneous composition of the alloys used for the different investment casting tests. 10 kg batches have been melted for each master alloy, using a medium frequency induction heated furnace with a machined graphite crucible with bottom pouring. The temperature has been monitored with an immersion thermocouple and the whole melting and casting cycle has been controlled through a PLC.
Casting grain has been produced from all master alloys. Melting and casting have been carried out under an argon atmosphere.
 |
| Table 2. Tests and equipment for the characterization of the alloys |
Burnout, Melting and Casting
For each alloy, five identical flasks have been cast and 150 g of 750‰ gold alloy have been cast for each flask. Flask size was 100 mm dia. x 150 mm height.
A very common brand of gypsum bonded investment has been used for the mould preparation. The following burnout cycle has been followed: dry dewaxing at 200°C (3 hours), heating from 200°C to 750°C in 5 hours, holding at 750°C (3 hours), cooling to casting temperature in 30 minutes, holding at casting temperature for temperature homogenisation (2 hours). Five flasks have been put into the furnace for each burnout operation. In all tests the casting temperature of the flasks has been 700°C.
Specific flasks have been used for the form-filling capability test and, in this case too, five flasks have been cast for each alloy, but the weight of the cast alloy was 80 g, and only two grid patterns have been mounted on each tree, Figure 4.
Melting of the gold alloys has been carried out in a resistance heated electrical furnace with static casting. Temperature has been monitored with an immersion thermocouple. The molten metal was protected with a boric acid cover flux. Alloy casting temperature has been:
- 150°C superheat above liquidus temperature for the form filling capability tests
- 100°C superheat above liquidus temperature for all other tests.
After casting, all flasks have been left to cool for 20 minutes, prior to quenching in water at 25°C. For cleaning from investment residues, all cast trees have been pickled in the same identical way, to get perfectly comparable samples and to avoid all forms of etching by acids.
 |
| Table 3. Physical properties |
Results
Physical Properties
We have measured density, melting range, colour and grain size. The density, melting range and colour coordinates of each alloy are shown in Table 3. Grain size is shown in Figures 5 and 6 and the colour data have also been plotted in Figure 7.
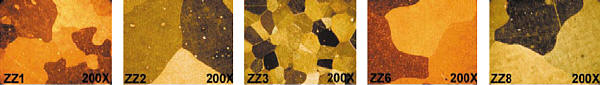
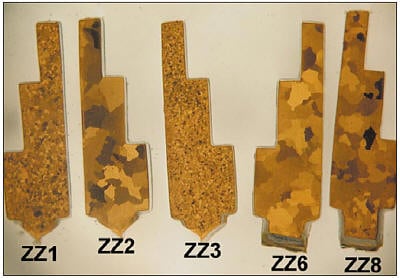 |
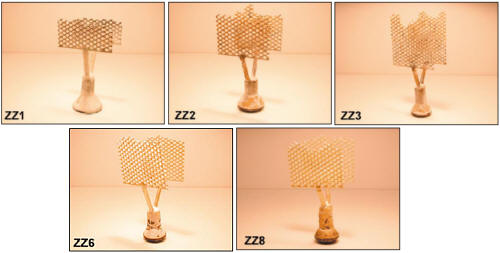
| Figure 5 - Grain size. ZZ1=alloy A; ZZ2=alloy B; ZZ3=alloy C; ZZ6=alloy D; ZZ8=alloy E |
Liquidus and solidus temperatures are very similar for all alloys, except for alloy A which does not contain Zn. These have been measured by differential thermal analysis (the DTA curves are not given in this paper): the liquidus temperature corresponds to the peak in the heating curve and the solidus temperature corresponds to the peak in the cooling curve.
Alloy A has been used as a colour reference. The changes caused by the alloying additions have been measured, Figure 7, and it can be seen that the colours of alloys B(1), C(2), D(3) and E(4) are very similar and are only slightly different from the colour of alloy A (which corresponds to the zero point of the plot). There is only one important feature: the values of the brightness parameter L show that alloy C(2) is slightly brighter than the other tested alloys. More specifically, alloy C(2) is significantly brighter than alloy B(1), although the compositions of these alloys are very similar, the only difference being the addition of a small quantity of iridium (Ir) in alloy C(2). One of the major objectives of the goldsmith is to obtain bright products, so the value of L is quite important.
 | ||||
| A | B | C | D | E |
| Figure 6 - Grain Size - Enlarged | ||||
The examination of grain size gave very interesting results, Figures 5 and 6. The grain sizes of alloys B and E are much larger than that of alloy C and somewhat larger than alloy A. The major effect seems to be related to Zn addition, because the grain size of alloy A is fairly small, while in alloy B (which differs from alloy A only by the addition of Zn) the grain size is significantly larger. The addition of iridium has a strong effect on grain size, because the grain size in alloy C is much finer than in alloy A. In our case the effect of iridium addition appears to be determinant, because grain refinement improves aesthetic, mechanical and technological properties of the alloy.
The grain sizes of alloys D and E are very similar to alloy B. But D and E alloys contain a grain refining addition (Co or Ir), so we could suppose that the addition of silicon (Si) alone would lead to a still larger grain size.
 |
| Figure 7 - Plot of colour coordinates difference |
Analysis of Alloy Composition
The results of chemical analyses carried out on the master alloys and on the castings are shown in Tables 4 and 5 respectively. It can be seen that in both cases the analyses are in good agreement with the nominal composition of the alloys. In the case of the master alloy, each of ten casting grains were subjected separately to spectrographic analysis. The averages of these results are given in Table 4.
 |
| Table 4. Chemical analysis of the master alloys |
 |
| Table 5. Chemical analysis of the castings |
Mechanical properties The data shown in Table 6 include hardness in the as cast and age-hardened (2hrs @280 °C, slow cool) conditions and tensile properties. Some tensile tests gave invalid results because of high porosity or blowholes and the proportion of these invalid tests are also included. Examples of these defects are shown in Figures 8 and 9 and the averaged stress - extension curves of the tensile tests are shown in Figure 10.
 |
| Table 6. Mechanical properties [* 2 hours at 280°C, slow cool] |
 | |
| Figure 8 - Blowhole in tensile test specimen | Figure 9 - Defects in tensile test specimen |
 |
| Figure 10 - Averaged tensile test curves |
Results of the Vickers Hardness Evaluation
Results of the Vickers hardness evaluation for the as cast alloys show that there are only minor differences, with the exception of the traditional Au-Ag-Cu alloy (alloy A) and of the silicon-cobalt alloy (alloy D), where hardness is about 5% higher. Subsequently, all alloys have been subjected to an age hardening treatment (2 hours at 280°C - slow cooling) to increase hardness. The results are satisfactory with a hardness increase of about 75% in comparison with the as cast alloys. This is a favourable circumstance, because higher hardness makes finishing easier and improves the end result. Some castings were also solution annealed before age hardening, but measured the hardness figures were not appreciably different.
The tensile test results have enabled the general behaviour of each alloy to be assessed. The so-called traditional alloys, A and B, have shown relatively poor characteristics, because there has been a high percentage of invalid tests due to the presence of macro-defects in the cross section of the test pieces, Figures 8 and 9. The test specimens of alloys C, D and E have shown a better performance, with very good strength and reliability. The highest percent elongation has been shown by alloy E (containing Si+ Ir); alloy D (containing Si + Co) has been the most reliable. Alloy C (containing Ir) showed the highest tensile strength, a result that was expected because of the finer grain size. In addition, Ir helps to reduce defect levels, because alloy B - identical, but without iridium - has given 30% of invalid results, in comparison with 10% of the iridium containing alloy C. However, further research is needed for a better understanding of the causes that lead to a reduction in defects.
The appearance of typical broken test specimens is shown in Figure 11 where it can be seen that the test specimen of alloy C (ZZ3) shows the best surface texture. From the different mechanical tests, it can be deduced that, on the whole, alloy C is more reliable and more suitable for casting.
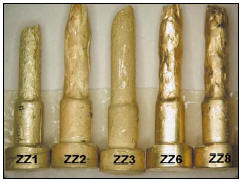 |
| Figure 11 - Fractured tensile test specimens |
Technological Characteristics
We have collected in this group the form filling performance, the appearance of the as cast pieces (deoxidation) and mapping of surface defects. Data on form filling capability for the different alloys, i.e. the mould filling as a percentage of the total test form - is shown in Table 7. It can be seen that alloy C shows the best form filling capability and alloy A the worst. As already stated, the test has been repeated five times for each alloy, so it is reasonable to say that alloy C is more suitable for filling intricate moulds. Maybe the fluidity of alloy C can explain this phenomenon. This supposition is supported by the fact that alloy E, which contains silicon in addition to iridium, has an appreciably different fluidity - in comparison with alloy C - and shows a reduced form filling capability.
 |
| Table 7. Form filling capability |
 | Figure 12 - Form filling capability tests |
As far as deoxidation of cast pieces is concerned, the silicon-containing alloys D and E performed very well, as would be expected. Figures 4 and 12 (a-e) give a good idea of the results. Specimens from alloys A, B and C were oxidized, even if the Zn addition to alloys B and C contributed slightly to deoxidation. Alloy A gave the poorest performance. This result should not be underestimated. Even though it can be removed by pickling, copper oxide on the surface of the castings can result in a discolouration of the cast pieces unless the goldsmith succeeds in thoroughly cleaning the surface by the mechanical removal of the surface layer (e.g. inner side of rings or of hollow medals, pavé setting, etc.). Because of copper oxidation, the surfaces of the pieces become enriched in gold and silver and the colour shifts towards a greenish shade. Therefore, we will see pieces showing a quite different colour between the areas that have been cleaned with brush wheels and the areas that have not been mechanically cleaned, because mechanical cleaning is the only way to remove these surface layers effectively.
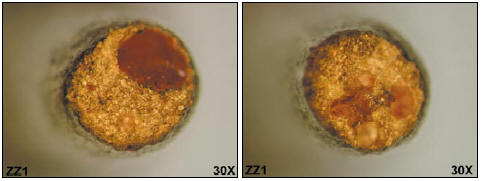
Now we come to a part of our work that is probably the most interesting: defect mapping. We have carefully observed the surface of polished specimens of the different alloys under the optical microscope and the SEM (Scanning Electron Microscope). Typical pictures are shown in Figure 13.
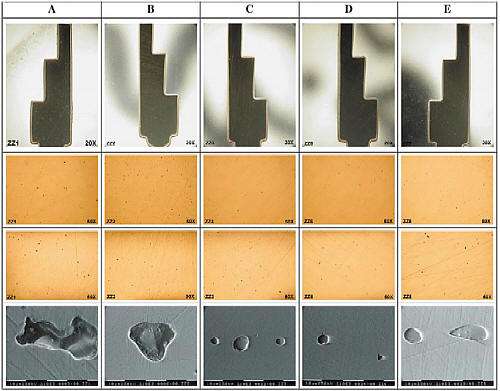 |
| Figure 13 - Defect mapping |
Not one of the alloys shows any evident shrinkage defects. This is fairly usual for yellow golds; defects of this type are much more frequent in white golds. It is known that, in yellow gold alloys, the most common defects are produced by gas. We observed that gas porosity is more frequent in the traditional alloys A and B. The other alloys also show gas porosity but, after a careful observation under the SEM, we concluded that in alloys C, D and E the average pore size is markedly lower. This can be seen in the average defect size, Table 8.
 |
| Table 8. Defect size |
Gas porosity arises from the following causes: turbulence during mould filling, low form filling capability or reaction between investment and the molten metal. The alloys with lower form filling capability, alloys A and B, showed a higher number of defects. In contrast, the alloys showing a better form filling capability - alloys C, D and E - also showed a lower number of gas related defects and blowholes. In this part of our study, alloy D showed the best performance but alloy C also performed satisfactorily. Moreover, in alloys A and B we have found large blowholes, Figures 8 and 9, that compromised the result of tensile tests. In the specimens we observed later, such defects were no longer observed; however, the probability for their occurrence stays high. With regard to intermetallic compound formation between Si and Co or Si and Ir, the presence of segregated particles has not been observed in alloys D and E.
Conclusions Whilst we recognise that further experimentation may be required, we can, however, draw the following conclusions from the results obtained in this study:
- In the investment casting process, traditional alloys give poorer performance in comparison with the alloys containing suitable addition elements.
- The better alloys C, D and E gave improved performance but they are much more critical. An incorrect use may cause reactions between alloying elements or segregation of the alloying elements from the molten metal and could annihilate the expected improvement completely. For example, alloy C, if it is not fully homogeneous, can give rise to defects caused by iridium segregation that impair finishing irreparably. Alloys D and E, if they are remelted too many times, can lose their deoxidation characteristics because of silicon loss. If these alloys are overheated, there is the risk of reaction between silicon and the grain refiners (Co and Ir), with the formation of intermetallic compounds that impair finishing of jewellery pieces.
- The production of these improved alloys by goldsmiths in their workshops is risky. The master alloys should be prepared by metallurgical experts, able to produce them with the correct practice and to control the homogeneity of the product with suitable analyses. Adding Ir, Si or Co to the master alloy is very risky, if we are not able to ensure their distribution as uniformly as possible. Adding these elements directly to the precious metal alloy is even more risky.
References for further reading
- D. Ott, "Influence of small additions and impurities on gold and jewelry gold alloys", Proc. Santa Fe Symposium on Jewelry Manufacturing Technology, 1997, p. 173. See also: Gold Technology, No 22, July 1997, p31.
- G. Normandeau, "The effect of various additives on the performance of an 18 karat yellow gold investment casting alloy", Proc. Santa Fe Symposium on Jewelry Manufacturing Technology, 1996, p. 83.
- G. Normandeau and R. Roeterink, "The optimisation of silicon alloying additions in carat gold casting alloys", Gold Technology No 15, 1995, p. 4.
Related Articles

The Metal Underneath

Platinum Alloy Applications for Jewelry
Alloys – Look on the White Side

Electric Kiln Fired Mokume Gane Part 2


The All-In-One Jewelry Making Solution At Your Fingertips
When you join the Ganoksin community, you get the tools you need to take your work to the next level.